The following shows you how to join a CSV to a shapefile with multiple features. In this case, a number of random points and a map of the World, we are only going to include a few Countries in South East Asia and Oceania, so we will be filtering the shapefile.
You might, for example, have a database of shipwrecks and want to improve the functionality of their maps by calculating the distance to the nearest shoreline and adapt the map display accordingly.
- Find points that lie within polygons (Countries).
- Find points that lie outside polygons (Countries).
- Calculate Distance to Nearest Landmass (Distance is calculated between the points and the enclosed area of the polygons, so points inside the polygons have zero distance).
- Calculate Distance to Nearest Shore (Distance is calculated between the points and the polygon outlines or “boundaries”, so this distance calculation also works for points within the polygons).
- Finally, use the above calculations to figure out the best zoom level to use when building a google map to display a point. The maps for points in the middle of the ocean would be more helpful if they were zoomed out so that other features can be seen to orient the viewer. Calculate map zoom levels.
notebook.ipynb
import csv
import geopandas
import pandas as pd
Load Map of The World
- Original source: https://www.naturalearthdata.com/downloads/10m-cultural-vectors/
world = geopandas.read_file(
    'zip://source-data/ne_10m_admin_0_countries.zip',
    crs='epsg:4326'
)
Filter shape file
Filter to those countries/regions that we are interested in, in this case Australia and surrounding South East Asian Countries
southeastasia = world[(
    world['NAME'] == "Australia") | (world['SUBREGION'] == "South-Eastern Asia"
)]
Load points from CSV
# Load 400 random points
points = pd.read_csv(
'source-data/400_points.csv',
sep=',',
encoding='utf8',
keep_default_na=False,
dtype = str
)
# filter out records that do not have complete lats and longs (not needed in this
# dataset but a useful step nonetheless)
points = points[(points['lat_dec'].notnull()) & (points['long_dec'].notnull())]
# Take separate lat and long fields and turn them into a geometry field for
# geospatial analysis make sure they are in the same crs as the shape file
# for spatial joins
geopoints = geopandas.GeoDataFrame(
points[['ID', 'lat_dec','long_dec']],
geometry=geopandas.points_from_xy(
points['long_dec'],
points['lat_dec'],
crs='epsg:4326'
)
)
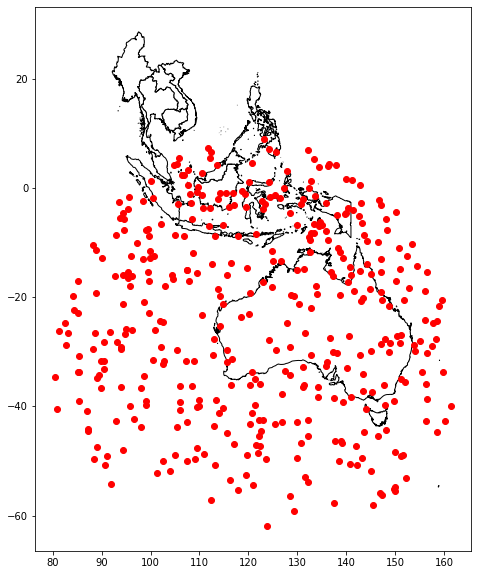
print(geopoints)
# plot on a map against filtered countries
base = southeastasia.plot(
color='white',
edgecolor='black',
figsize=[10,10]
)
geopoints.plot(
ax=base,
marker='o',
color='red'
)
      ID       lat_dec      long_dec                     geometry
0      1  -39.85286522   95.80899344   POINT (95.80899 -39.85287)
1      2  -43.80457004   97.96712854   POINT (97.96713 -43.80457)
2      3  -52.45869299    119.423039  POINT (119.42304 -52.45869)
3      4   -2.82095319  143.02876559   POINT (143.02877 -2.82095)
4      5   -12.7989192   90.08023952   POINT (90.08024 -12.79892)
..   ...           ...           ...                          ...
395  396   -39.2177044  106.05543555  POINT (106.05544 -39.21770)
396  397    1.29818204  100.13546985    POINT (100.13547 1.29818)
397  398  -44.63687045  158.58206396  POINT (158.58206 -44.63687)
398  399  -30.68850142   85.46962396   POINT (85.46962 -30.68850)
399  400  -19.83369329   84.14911177   POINT (84.14911 -19.83369)

[400 rows x 4 columns]
Perform Spatial Join
Perform left join so we keep those points outside of Countries
join = geopandas.sjoin(
    geopoints,
    southeastasia,
    predicate='within',
    how='left'
)
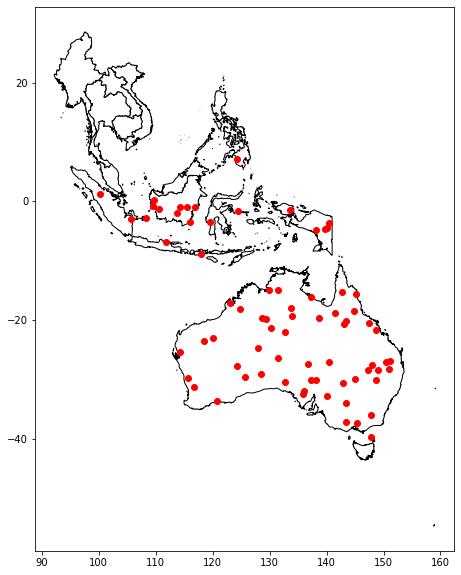
Points Inside of Country’s Landmasses
# Inside points are those with non-null values for "right" columns in joint result
inside = join[join['index_right'].notna()]

# plot
base = southeastasia.plot(
    color='white',
    edgecolor='black',
    figsize=[10,10]
)
inside.plot(
    ax=base,
    marker='o',
    color='red'
)
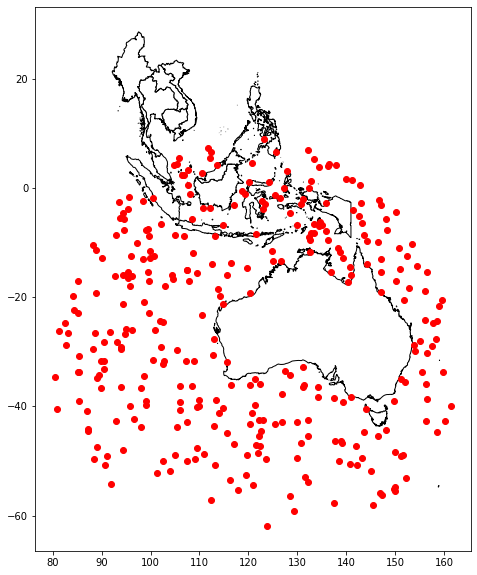
Points Outside of Country’s Landmasses
# Points outside will have null values for "right" columns in joint result
outside = join[join['index_right'].isna()]

# plot
base = southeastasia.plot(
    color='white',
    edgecolor='black',
    figsize=[10,10]
)
outside.plot(
    ax=base,
    marker='o',
    color='red'
)
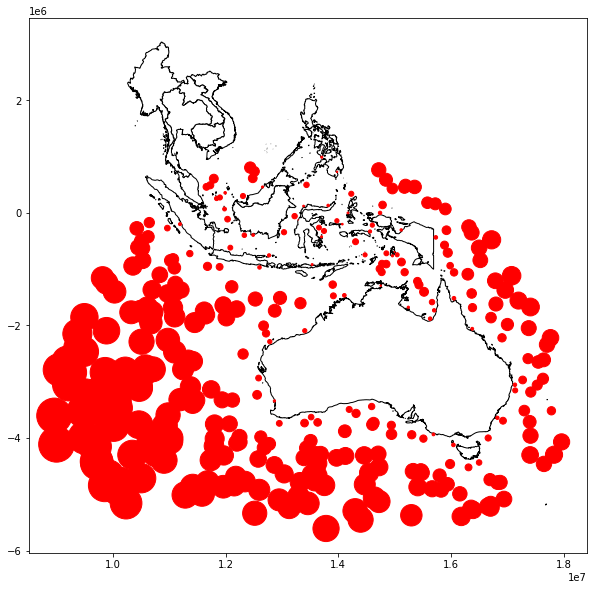
Calculate Distance to Nearest Landmass
- Choose the right projection for accurate distance calculations: https://gis.stackexchange.com/a/401815
- Distance to Landmass:
- Distance measured in meters.
- Distance is a measure of how far a point is outside of selected Countries.
# Set the projection for distance calculations
southeastasia = southeastasia.to_crs('+proj=cea')
geopoints = geopoints.to_crs('+proj=cea')

# Calculate distance the nearest landmass
geopoints['distance_to_land'] = geopoints.geometry.apply(
    lambda x: southeastasia.distance(x).min()
)

# Plot points on a map with marker size indicating distance to landmass.
base = southeastasia.plot(
    color='white',
    edgecolor='black',
    figsize=[10,10]
)
geopoints.plot(
    ax=base,
    marker='o',
    markersize=geopoints['distance_to_land']/3000,
    color='red'
)
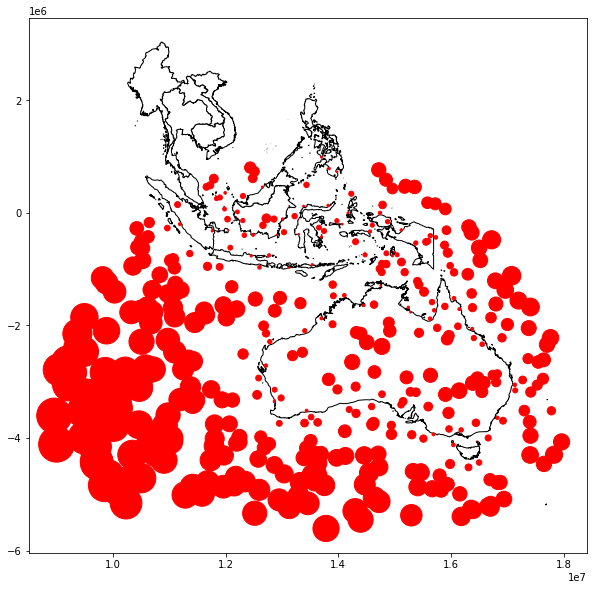
Calculate Distance to Shore
- This time we calculate distance to geometry boundary, so points that lie within will also get a distance value or “Distance to Shore” in this case since we are dealing with Landmass.
# Calculate distance the nearest Boundary
geopoints['distance_to_shore'] = geopoints.geometry.apply(
    lambda x: southeastasia.boundary.distance(x).min()
)

# Plot points on a map with marker size indicating distance to shore.
base = southeastasia.plot(
    color='white',
    edgecolor='black',
    figsize=[10,10]
)
geopoints.plot(
    ax=base,
    marker='o',
    markersize=geopoints['distance_to_shore']/3000,
    color='red'
)
Calculate map zoom levels
- The farther from shore the lower the zoom level so we get a better chance to see other features on the maps.
- Bin distance to create a new field using bin labels that equate to google map zoom levels.
geopoints['zoom'] = pd.cut(
    geopoints['distance_to_shore'],
    [-1, 5000, 10000, 300000, 500000, 2000000, 10000000],
    labels=['13', '12', '7', '6', '5','4']
)

# Create a google map preview link
geopoints['map'] = 'https://www.google.com/maps/place/' \
    + geopoints['lat_dec'] \
    + ',' + geopoints['long_dec'] \
    + r'/@' + geopoints['lat_dec'] \
    + ',' + geopoints['long_dec'] + ',' \
    + geopoints['zoom'].astype(str) +'z'

with pd.option_context('display.max_colwidth', 200, 'display.max_columns', None):
    print(
        geopoints[
            ['ID', 'lat_dec', 'long_dec', 'distance_to_shore', 'zoom','map']
        ].sort_values(
            'distance_to_shore',
            ascending=False
        )
    )
      ID       lat_dec      long_dec  distance_to_shore zoom  \
189  190  -40.39445707   80.82484509       3.816485e+06    4
322  323  -34.62180392   80.47492498       3.713126e+06    4
78    79  -38.98330258   85.32416467       3.302106e+06    4
11    12  -28.74735114   82.81386424       3.265730e+06    4
362  363  -44.50434097    87.2687035       3.211167e+06    4
..   ...           ...           ...                ...  ...
146  147    -6.3161373  134.73326926       2.600519e+03   13
22    23  -39.76145553  147.87089705       6.359197e+02   13
281  282   -1.15560281  119.37724056       5.650494e+02   13
255  256   -0.72538033  109.51278953       3.556696e+02   13
95    96   -1.66114237  124.40984103       1.073255e+02   13

                                                                                            map
189     https://www.google.com/maps/place/-40.39445707,80.82484509/@-40.39445707,80.82484509,4z
322     https://www.google.com/maps/place/-34.62180392,80.47492498/@-34.62180392,80.47492498,4z
78      https://www.google.com/maps/place/-38.98330258,85.32416467/@-38.98330258,85.32416467,4z
11      https://www.google.com/maps/place/-28.74735114,82.81386424/@-28.74735114,82.81386424,4z
362       https://www.google.com/maps/place/-44.50434097,87.2687035/@-44.50434097,87.2687035,4z
..                                                                                          ...
146      https://www.google.com/maps/place/-6.3161373,134.73326926/@-6.3161373,134.73326926,13z
22   https://www.google.com/maps/place/-39.76145553,147.87089705/@-39.76145553,147.87089705,13z
281    https://www.google.com/maps/place/-1.15560281,119.37724056/@-1.15560281,119.37724056,13z
255    https://www.google.com/maps/place/-0.72538033,109.51278953/@-0.72538033,109.51278953,13z
95     https://www.google.com/maps/place/-1.66114237,124.40984103/@-1.66114237,124.40984103,13z

[400 rows x 6 columns]
Merge Additional fields back into Original data
- This step is needed if there are any records in the original dataset that did not have geospatial information and were filtered out after loading the points.
# Nicer formatting of distances
geopoints['distance_to_shore'] = geopoints['distance_to_shore'].astype(int)
geopoints['distance_to_land'] = geopoints['distance_to_land'].astype(int)

# Add extra fields to original Wrecks
export_points = pd.merge(
    points,
    geopoints[['ID', 'distance_to_shore', 'distance_to_land', 'zoom','map']],
    how="left",
    on="ID"
)

export_points.to_csv('artifacts/400_points-enriched.csv',index=False)
PREVIOUSPentaho and Filemaker Pro